The Ultimate Beginner’s Guide to Website Analytics
Introduction
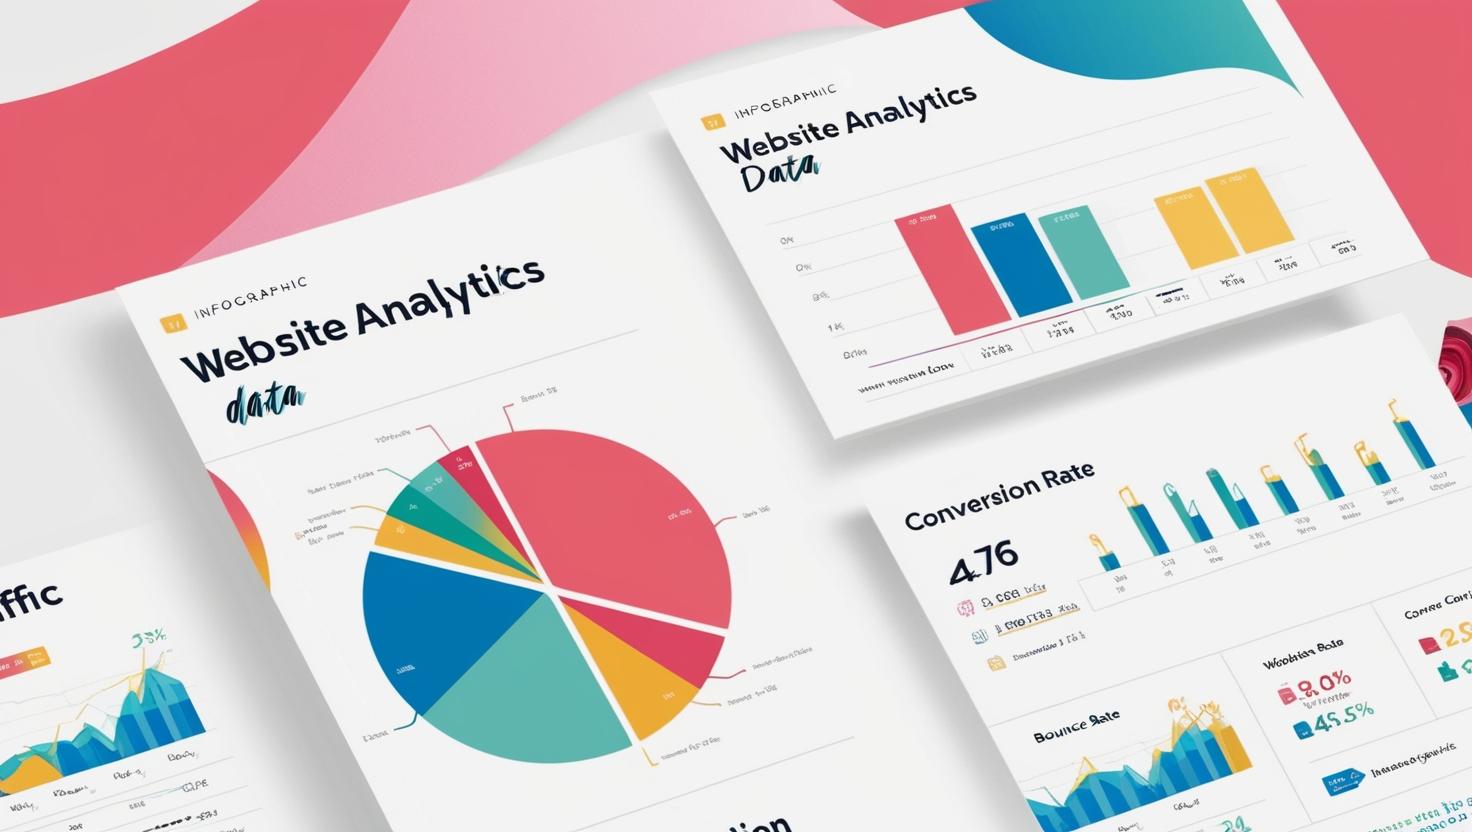
Ever wonder what happens after someone lands on your website? Are they clicking around, bouncing off, or converting into loyal customers? That’s where website analytics comes in. Think of it like having x-ray vision for your website—it shows you exactly how your visitors behave and what you can do to improve their experience.
In this beginner’s guide, we’ll walk you through the key metrics you should track, why they matter, and how to use that data to grow your site like a pro.
Why Website Analytics Matter
You can’t improve what you don’t understand. Website analytics gives you the data you need to:
- Understand your visitors
- See what content works (and what flops)
- Optimize your marketing strategies
- Boost conversions and sales
It’s not about vanity metrics. It’s about gaining insights that drive real results.
Start with the Basics: What Tools to Use
Before we dive into the “what to track,” let’s look at how to track it. The most popular (and free) tool is Google Analytics. It provides in-depth reports on traffic, behavior, conversions, and more.
Other tools you might consider:
- Microsoft Clarity – for heatmaps and session recordings
- Hotjar – user behavior insights
- Matomo – a privacy-focused alternative to GA
Set one of these up before moving forward. Most platforms offer easy integration with your website.
Key Metrics Every Beginner Should Track
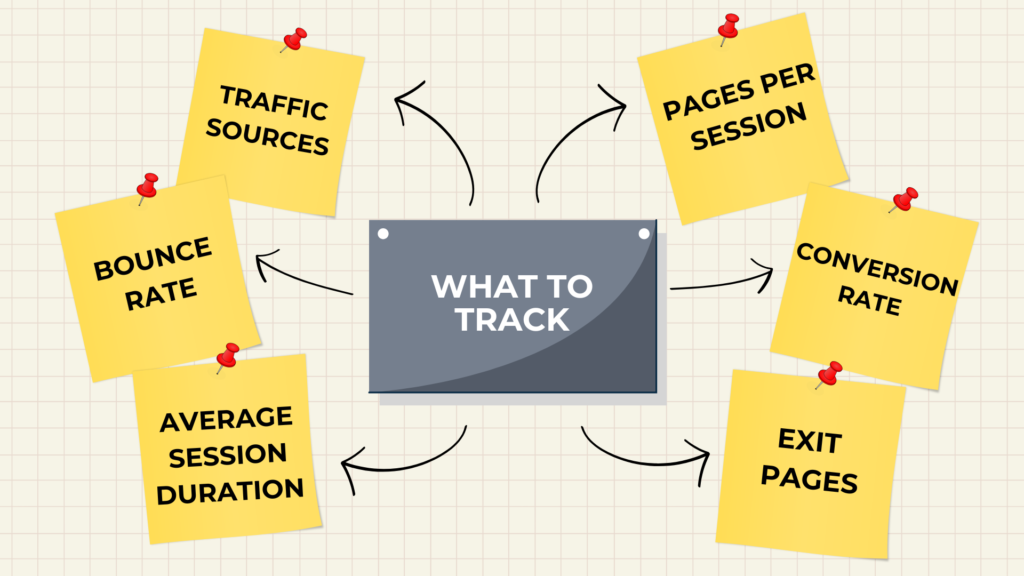
1. Traffic Sources
Where is your traffic coming from? This metric breaks it down by:
- Organic search (Google, Bing)
- Social media
- Direct (typing your URL)
- Referral (from other sites)
- Paid ads
Tracking this helps you see which marketing channels are working and which ones need tweaking.
2. Bounce Rate
Bounce rate shows the percentage of users who leave your site after visiting only one page. A high bounce rate could mean:
- Your page didn’t match their intent
- The site loads too slowly
- Your content isn’t engaging enough
Use this metric to identify weak pages that need improvement.
3. Average Session Duration
This tells you how long people are sticking around. The longer they stay, the more engaged they are. If your session duration is low, try:
- Adding engaging visuals
- Breaking content into easy-to-read chunks
- Embedding videos or interactive content
4. Pages Per Session
This metric shows how many pages a visitor checks out before leaving. More page views generally mean better site structure and compelling content.
Pro tip: Use internal links to guide users from one page to the next (like we’re doing now—see our Blog on UX Audits for more insights).
5. Conversion Rate
Conversions can be:
- Purchases
- Form submissions
- Email sign-ups
- Downloads
Set up goals in your analytics platform to measure what matters most to your business.
6. Exit Pages
These are the last pages people visit before leaving. If users are exiting from an important page (like your checkout or services page), it’s time to investigate and optimize.
How to Use This Data to Improve Your Website
Knowing the numbers is just the start. Here’s how to turn analytics into action:
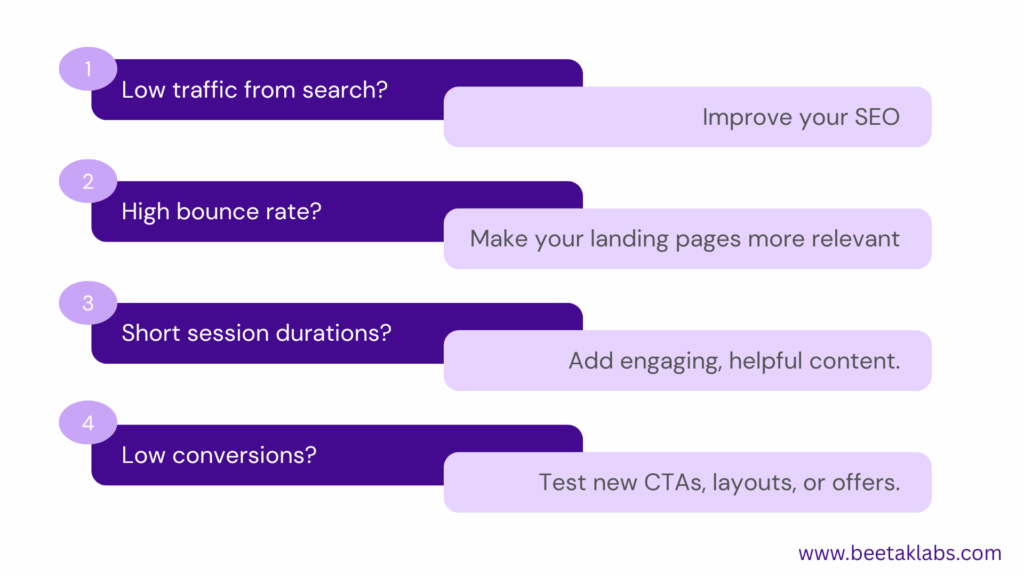
Analytics isn’t about guessing—it’s about making data-driven decisions that actually work.
Final Thoughts
Website analytics might seem overwhelming at first, but once you get the hang of it, it becomes your secret weapon. Whether you run a small blog or a full-scale eCommerce site, tracking the right data helps you understand your audience and deliver what they’re really looking for.
So, install your tracking tool, start watching the numbers, and most importantly—act on them.
You Might Also Be Interested in

Mind-Blowing Ways AI Will Transform the World Around You

Unlock Business Success: How a Stunning Website Design Impacts Growth